What Happened if Unit-Tests Unlock Self-Healing in Go?
Driving unit test coverage is essential but very dull. We need to make it as fun as possible. And for the “shippable” OSS products, it’s vital. It differs from the SaaS world, where you roll out an emergency release for all users. Once a user downloads something and runs it in their environment — it’s done. You cannot effortlessly swap the binary artifact. And if it’s broken — it’s your fault. The best way to prevent this is decent unit-testing coverage. This time we’ll cover something boring and automatable — API calls to a predefined service.
It’s important to remember that writing unit tests is essential. It is the software development process. It can help ensure the code works as intended and make it easier to maintain and update. The most time-consuming activity is writing fixtures. They represent the state of the world for the system under test. Different systems need different complexity of fixtures, especially for multi-threaded applications.
The technique I want to describe here has saved me plenty of time. Over the past two years, I’ve been developing an OSS project. It’s a miracle that I’ve maintained a 90% test coverage. Other variations of this technique have saved me even more time over the past thirteen years. In four companies. In five different programming languages and technologies. The most recent projects benefiting from this technique have 10M downloads .
I need to write new functionality that integrates with a REST API. I follow almost exactly the following steps:
- Create a new unit test with a basic boilerplate.
- Create basic interfaces for implementation.
- Run the test, and let it fail.
- Implement a feature that makes REST API requests.
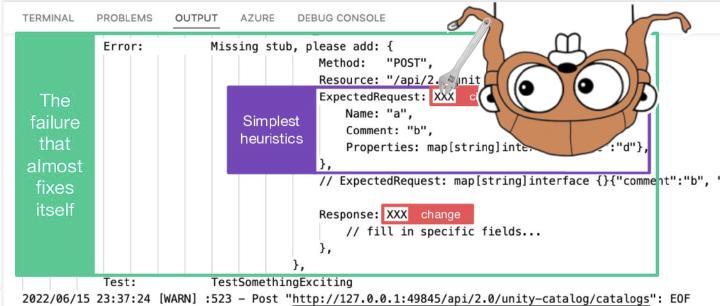
- Rerun the test, and let it fall with a hint.
- Copy the code from hint to test with almost ready expected requests and fill in the response I want.
- Run and debug the test until it passes.
Internally, every test case gets its HTTP server. It runs on a random port for isolation purposes. The only thing it does is match stub responses. We define them with simple rules in the “HTTP fixtures.” It’s nothing more than a custom request router. It fails the test case when no matching request ever arrives. It adds a generated code of the “missing fixture” to the failure message.
As a result — unit tests do read like documentation. They describe the HTTP behavior of the specific functionality. It allows less technical people to understand the intricate details quicker while troubleshooting. The main takeaway is fascinating. Invest in making a test DSL for your specific project the way it reads as documentation. It will eventually pay off and increase the contributors’ productivity.
You always spend way more time reading the code, not writing it.
// Typical unit test in https://github.com/databricks/terraform-provider-databricks
func TestCatalogCreateAlsoDeletesDefaultSchema(t \*testing.T) {
 qa.ResourceFixture{
  Fixtures: \[\]qa.HTTPFixture{
   {
    Method:   "POST",
    Resource: "/api/2.1/unity-catalog/catalogs",
    ExpectedRequest: CatalogInfo{
     Name:    "a",
     Comment: "b",
     Properties: map\[string\]string{
      "c": "d",
     },
    },
   },
   {
    Method:   "DELETE",
    Resource: "/api/2.1/unity-catalog/schemas/a.default",
   },
   {
    Method:   "GET",
    Resource: "/api/2.1/unity-catalog/catalogs/a",
    Response: CatalogInfo{
     Name:    "a",
     Comment: "b",
     Properties: map\[string\]string{
      "c": "d",
     },
     MetastoreID: "e",
     Owner:       "f",
    },
   },
  },
  Resource: ResourceCatalog(),
  Create:   true,
  HCL: \`
  name = "a"
  comment = "b"
  properties = {
   c = "d"
  }
  \`,
 }.ApplyNoError(t)
}
Another variation here is when you specify a callback for a request. It works well only if you have a single type of request coming into your API mock. It doesn’t scale in case you need to test multi-request interactions.
Lots of copy-paste? Kind of. But having a readable test-as-documentation is better. For hundreds of people who need to become more familiar with the language/framework/code. Only elegantly reused variables for some requests. Only a dozen of active contributors to the project understand those. It would be best to assume that people review tests from a webpage or “dumb” editor. Not from the IDE with go-to-definition functionality.
Please don’t tell me, that you apply the same strict coding standards to your tests, as you do to your production code. Test coverage and readability matters, not the beautiful code.
What about flows with dozens+ requests? It’s a hard one. It’s best if such described test DSL uses the identical type instantiations as your domain model. So that the “find usages” IDE feature also shows the impact of a single field across the tests. For the stronger-typed languages, of course. But this becomes harder once the test case’s body grows bigger than one single screen can fit. And unmanageable once it’s more than two page-downs. We tried storing request fixtures in JSON files . Those don’t work well with our “self-healing test hints.” Imagine what happens when one of the expected requests doesn’t go through. At least in the frameworks that I’m working in.
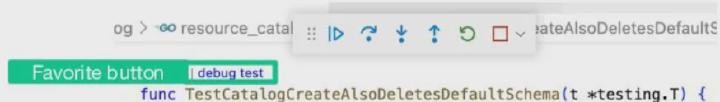
This unit test style enables another technique. You are reproducing the problem in a unit test and debugging it until the fix. This way of getting familiar with the behavior of an application is compelling. I recommend it as the primary way to start a project for any new contributor. Step into every function until you’re bored, and when you’re bored — debug for another hour. Unit tests must be debuggable for a few reasons:
- We are identifying and isolating issues. If a unit test fails, it can be challenging to determine the cause of the failure if the test is not debuggable. Debugging the test quickly can help identify and isolate the issue, making it easier to fix.
- We are maintaining and updating code. As code changes over time, unit tests may need to be updated to reflect those changes. If the tests are debuggable, it can be easier to determine why a test is failing.
- We are improving the test coverage. When debugging a test, we may release that it does not cover all the edge cases or some critical scenarios. In such cases, debugging the test can help improve the test coverage.
- We are improving the test quality. By debugging the test, developers can also improve the test quality. They make sure that the test is straightforward to understand. They force descriptive names and explicit assertions. They ditch any unnecessary or irrelevant code.
Being able to debug unit tests quickly is essential. It ensures that the tests are working as intended. The code works. It also enables developers to maintain and improve the test suite over time. It leads to better quality and more reliable software.
Repeat the debuggability mantra. Do not use Property-based testing. It’s more challenging to debug individual failures. Of course, it depends on tools and ecosystems. For Java with IntelliJ, it’s easy; for GoLang with “test tables” and VSCode, it’s a bit of a nightmare. So what exactly is property-based testing, at least in the ideal world where we don’t live? If you can, describe inputs and outputs for a single test case in under 256 characters. And have 5, 10, or 20 of those similar cases. Only then go ahead and proceed with a “test table.”
Where to focus first?
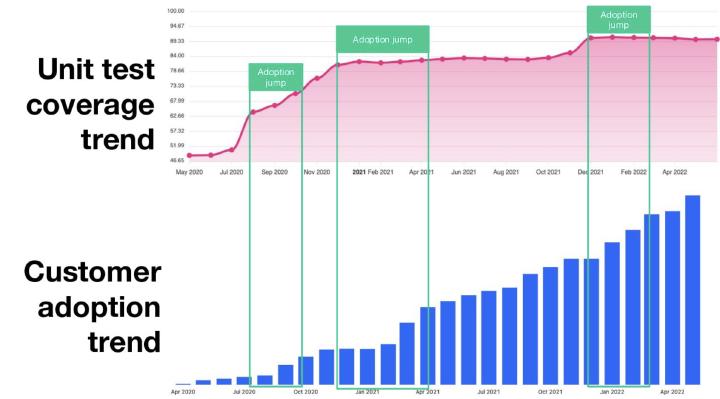
The first part of the article talks about the “how.” Now it’s the time to talk about “where.” Testing through HTTP fixtures is excellent for making initial rough passes. It’ll make the most significant positive impact. But how to identify the place and keep track of the progress? Let’s look at two examples.

We start with codecov.io SaaS, which tracks code coverage reports and visualizes them nicely. In the repository view, switch to the “File list” view and sort the table so that the files with the most missed lines appear first. It’s your priority list. If you don’t use codecov.io, fear no more: even dinosaurs like Jenkins have Cobertura reporters with a similar interface.
Suppose you are unable to find a similar report in your CI system. Or are you up to experimenting with less mature tooling? In that case, I’d recommend trying out the go-coverage CLI focused on Go. The main idea of this tool is to provide a short and focused list of methods or functions. They are sorted by their impact on the total code coverage of the project.
Got some literature?
Test coverage reporting in Go is distinct from those you used to in Java or Python. For example, “go test” says coverage by default only on the per-package level. You can fix this behavior by launching it with the -coverpkg argument. There are plenty of other, more orthodox, test-driven development tricks for this language. Please check out my other blog post with reviews on books that preach TDD .